
Introduction
This post is the second in a series; click here to read the first post if you haven’t already done so. In this series, I will show how I created the plots that Aiden Oakley published on Twitter here and here, alongside some commentary about the choices I made throughout the process and my own interpretations of the results.
Getting started
We’ll load the cleaned data in and load the necessary libraries as we did in the first post.
# Load libraries
library(readr)
library(knitr)
library(kableExtra)
library(ggplot2)
library(dplyr)

# Read the data into R
dataSource <- "https://raw.githubusercontent.com/jacquietran/soccerSalariesDataPublic/master/soccerSalariesDataPublic.csv"
soccerSalariesData <- read_delim(dataSource, delim = ",", col_names = TRUE, col_types = NULL)
Salaries by position
What happens when we categorise responses by job ‘seniority’? We can exclude responses from unpaid interns from this analysis since, well, they’re unpaid, so their ‘typical salary’ works out to be £0.
# Subset of data frame to exclude position == NA | Intern
soccerSalariesData2 <- soccerSalariesData %>%
    filter(position != "Intern" & !is.na(position))

# Set factor levels
soccerSalariesData2$position <- factor(
    soccerSalariesData2$position,
    levels = c("Head", "Lead", "Coach"))

# Create a list to store common theme options for use across plots
plotFeatures <- theme(
    plot.title = element_text(size = 16),
    plot.subtitle = element_text(size = 14),
    axis.title.x = element_blank(),
  axis.text.x = element_text(size = 11),
    axis.title.y = element_text(size = 16),
    axis.text.y = element_text(size = 11),
    legend.position = "none")

# Build the plot
p <- ggplot(soccerSalariesData2, aes(x = position, y = salaryGBP))
p <- p + geom_boxplot(outlier.shape = NA, coef = 0)
p <- p + geom_point(alpha = 1/4, size = 4, aes(colour = position))
p <- p + scale_y_continuous(
    limits = c(0, 60000),
    breaks = seq(0, 60000, by = 10000))
p <- p + labs(
    title = "UK soccer salaries of support staff",
    subtitle = "By position: Department head, discipline lead, or 'coach'",
    y = "Salary (GBP)")
p <- p + plotFeatures
salaryByPosition <- p

# Display the plot
salaryByPosition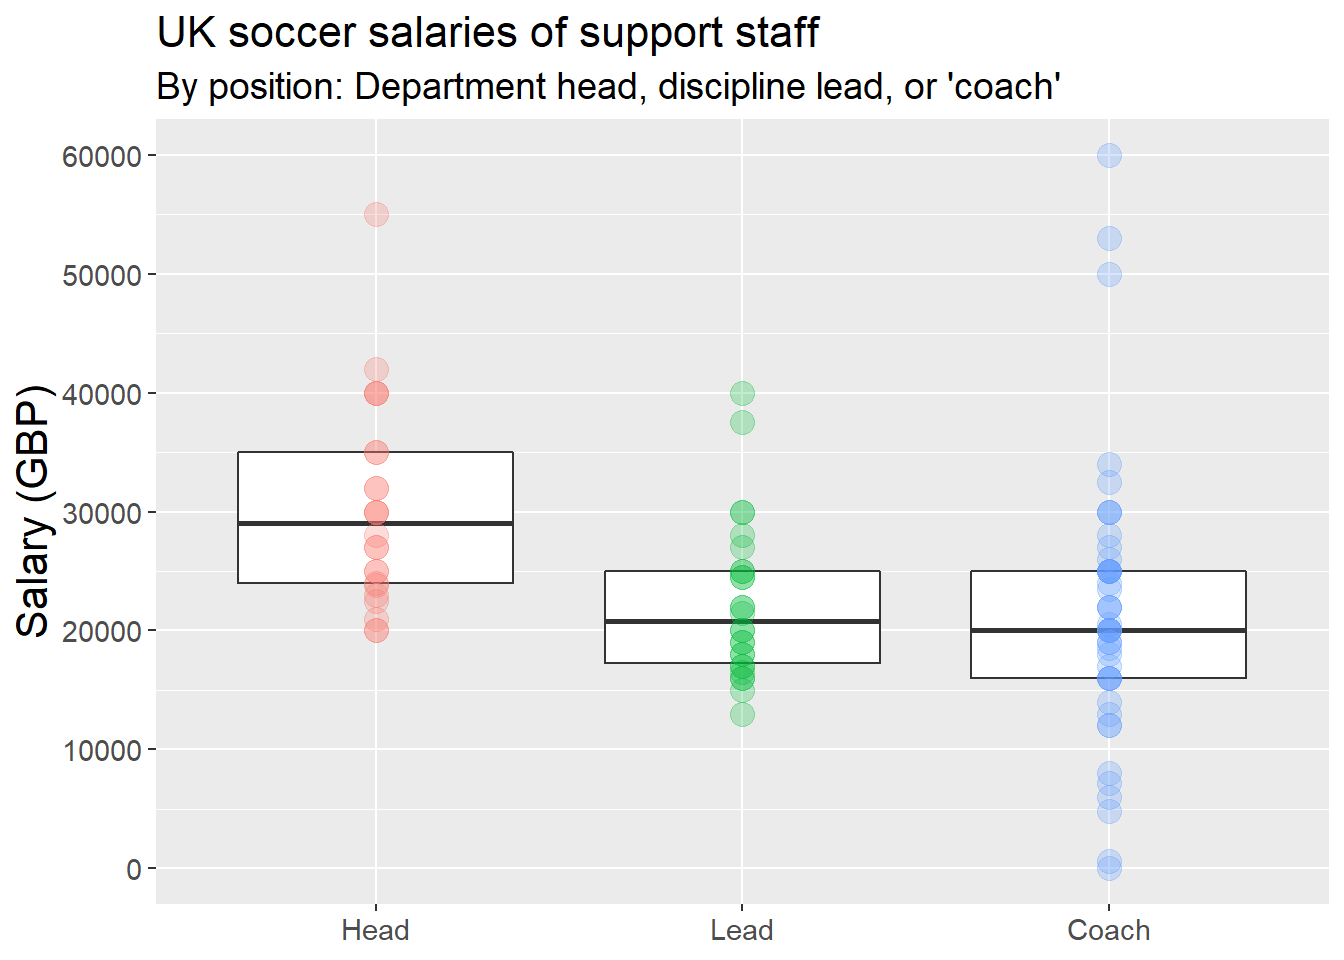
Let’s take a look at median salaries too:
# Calculate median salaries by position
medianSalariesByPosition <- soccerSalariesData2 %>%
    group_by(position) %>%
    summarise(median = median(salaryGBP, na.rm = TRUE))

# Add variable for defining position categories
medianSalariesByPosition$definition <- c(
    "Department head (e.g., Head of Sport Science & Sports Medicine)",
    "Discipline lead (e.g., Lead S&C coach)",
    "Staff who are junior to the Lead or Head (e.g., Sport Science Assistant)")

# Reorder columns
medianSalariesByPosition <- medianSalariesByPosition %>%
    select(position, definition, median)

# Rename variables for aesthetic purposes
colnames(medianSalariesByPosition) <- c(
    "Position", "Definition", "Median salary (GBP, £)")

# Display the table
medianSalariesByPosition %>%
    kable("html") %>%
kable_styling()| Position | Definition | Median salary (GBP, £) |
|---|---|---|
| Head | Department head (e.g., Head of Sport Science & Sports Medicine) | 29000 |
| Lead | Discipline lead (e.g., Lead S&C coach) | 20750 |
| Coach | Staff who are junior to the Lead or Head (e.g., Sport Science Assistant) | 20000 |
Key findings
Hmm. Seems there’s quite a bit to take in! This is what jumped out at me:
1. Department heads are generally—but not always—paid more than staff at the Lead or Coach levels. A small number of respondents who are department heads are being paid less than some Leads and Coaches. We know that there is a descending gradient in the reported salaries by league, so these instances could be explained by Heads who work for teams in lower leagues (e.g., Championship, League 1, League 2), compared to Leads and Coaches who work for teams in higher leagues (e.g., Premier League, Scottish Premiership).
2. Typical salaries of Leads and Coaches are not remarkably different. Again, considerable variation is evident within each category. Even if we were to exclude the three upper outliers in the ‘Coach’ group, there are still many overlaps between the 2nd and 3rd categories here.
3. Some respondents working at the Coach level are unpaid or may be underpaid (depending on the time loading in their role). These data points are not explained by interns, since we excluded them from the data set before building the plot and table above. However, this data does include the following:
- One (1) sport scientist who reported earning £0, and another who reported earning £600,
- Six (6) respondents who reported earning less than £10,000, and
- Ten (10) respondents who reported earning less than £15,000. Of these individuals, eight reported having qualifications at the postgraduate (Masters, Postgraduate Certificate) or PhD level.
Entertaining alternative possibilities
On its face, these results do not make for positive reading. Importantly, whenever I am interpreting the results of any analysis, I work to actively think about alternative interpretations and possible explanatory factors. Here are a few:
1. Two of these respondents self-identified that they are working part-time, although their weekly time commitment is not known. It is possible that more of these apparently unpaid / underpaid respondents may be working part-time for their respective clubs, however this could not be accurately discerned from their questionnaire responses.
2. Some of these respondents may be current postgraduate students who are working and studying within a football club. For example, it’s common these days to see Masters and PhD students ‘embedded’ in applied settings. These students may be employed by a club in some capacity (or receiving a small remuneration / honorarium), while they are also conducting research within the same club or completing the placement hours needed to fulfil course requirements. In these instances, students may be receiving a stipend or scholarship to support their studies. This, in combination with a part-time wage, may add up to a sufficient living wage.
3. Perhaps many of the ‘Coaches’ happen to work for clubs competing in higher-paying leagues, while many of the ‘Leads’ happen to work in lower-paying leagues? We can attempt to discern this from the available data, a useful exercise that also highlights some of its limitations:
- Of the 26 Lead-level staff who completed the questionnaire, 7 work for clubs with first teams competing in either the Premier League or Scottish Premiership (7 / 26 = 27%). The remaining 19 work for clubs with first teams competing at Championship, League 1, or League 2 level (19 / 26 = 73%).
- Of the 47 Coach-level staff who completed the questionnaire, 19 work for clubs with first teams competing in either the Premier League or Scottish Premiership (19 / 47 = 40%). The remaining 28 work for clubs with first teams competing at Championship, League 1, or League 2 level (28 / 47 = 60%).
After looking at the data more closely, we now know that fewer Lead-level staff completed the questionnaire than Coach-level staff. We also know that fewer Lead-level staff are working for clubs with first teams in the top tier leagues, whereas there are more Coach-level staff working at this level. Perhaps what we see in the plot and table—the appearance of no difference between these two job levels—is actually the ‘league-level’ effect obscuring real differences that may exist between the salaries of Coaches and Leads. Maybe?
Scratching beneath the surface in this way, we have run into the eternal frustration of small samples. While a little over 100 responses might be enough to detect what appear to be fairly sizeable differences in staff salaries between leagues, it doesn’t give us enough clarity for answering more granular questions (e.g., ‘Given known differences between leagues, are there additional differences in staff salaries when categorising by job seniority?’).
So what?
Where does that leave us? Is there a difference between Coach and Lead salaries, or not? The answer is…
We don’t know. At least, we don’t know yet. With this data, we cannot confidently conclude that there is no difference but we also cannot conclude that there is a difference. We need better information and probably more of it to arrive at a conclusive judgment. Nevertheless, I think there is enough of a query here to warrant further exploration, further data capture, and further self-questioning (as an industry):
- Do we, as a professional community, think there is a real difference between what it takes to do the job of a ‘Lead’ compared to the ‘Coach’-level roles?
- If we think there is a real difference between these two job levels, then why are the more senior ‘Lead’ staff not being paid commensurate to their higher experience, skill, qualifications, degree of accountability?
- If we think there is no real difference between these two job levels, then the lack of difference in their typical salaries is not an issue. But then, the question becomes: Why persist with ‘Lead’ designations for sport scientists and S&C coaches?
What’s next?
In the next post, I will examine how the salaries of S&C coaches compare to those of sport scientists working for UK football clubs.
Enjoying the series so far? Constructive feedback and comments welcome via Twitter; my handle is @jacquietran.