The backstory
It’s a touchy subject for many. Yet this question—how much do you get paid?—is at the core of the online questionnaire that was recently administered by Aiden Oakley (@ajoakley on Twitter). And it is a question that was willingly answered by over 100 sport scientists and strength & conditioning coaches who currently work for football (soccer) clubs in the UK.
Why?
This job advert says it all…
This is shocking! "Dear Candidate, please spend £27,000 on BSc, then £1000 on ASCC, to be paid less than half of this. Oh, and the players earn your salary in one week." 🤔🤔🤔 pic.twitter.com/6efKtAaaQl
— Rob Chave (@Robchave7) December 14, 2017
Blackpool FC was roundly criticised for advertising such a position for a measly £12,000 per annum. The UK Strength & Conditioning Association then withdrew this job posting from their website. Regrettably, this is not a one-off. Blackpool happened to rightly draw the ire of the Twitter crowd on this occasion, but many of us working in sport have seen too many job ads just like this in our global industry.
So what is the current state of play when it comes to salaries in UK soccer?
Aiden set out to explore this question via a simple survey:
Off the back of Blackpoolgate are any S&C's/Sport Scientists willing to fill in a short questionnaire on salaries in football. Open to Premier League - League 2 and Scottish Premiership clubs,1st team & Academy.Will be shared on Twitter anonymously. Plz RT https://t.co/Gcyqiu0MP2
— Aiden Oakley (@ajoakley) December 16, 2017
After a fortnight, 100+ responses were received. I put my hand up to help with visualising the data. This post is the first in a series where I will show how I created the plots that Aiden published on Twitter here and here, alongside some commentary about the choices I made throughout the process and my own interpretations of the results.
Getting started
Let’s load the cleaned data in and load the necessary libraries. Note: Some variables were omitted during the data cleaning process to protect the anonymity of respondents.
# Load libraries
library(readr)
library(knitr)
library(kableExtra)
library(ggplot2)
library(dplyr)

# Read the data into R
dataSource <- "https://raw.githubusercontent.com/jacquietran/soccerSalariesDataPublic/master/soccerSalariesDataPublic.csv"
soccerSalariesData <- read_delim(dataSource, delim = ",", col_names = TRUE, col_types = NULL)
Now that we have the cleaned data loaded in, we can begin to examine it. The data set has 16 variables and 102 responses. For pedants like me, I’ve also included a data dictionary below.
# Examine first few observations of the data set
head(soccerSalariesData)
## # A tibble: 6 x 16
## responseID country leagueOfFirstTeam levelOfWork position dept partTime
## <dbl> <chr> <chr> <chr> <chr> <chr> <chr>
## 1 1 England Championship 1st Team Coach Sport Scie~ <NA>
## 2 2 England Championship 1st Team Head S&C <NA>
## 3 3 England Championship 1st Team Coach S&C <NA>
## 4 4 England Championship 1st Team <NA> <NA> <NA>
## 5 5 England Championship 1st Team Head Sport Scie~ <NA>
## 6 6 England Championship Academy Head Sport Scie~ <NA>
## # ... with 9 more variables: academyCategory <chr>, ageGroupAllPhases <lgl>,
## # ageGroupPDPhase <lgl>, ageGroupYDPhase <lgl>, ageGroupFPhase <lgl>,
## # reportedSalaryGBP <dbl>, salaryGBP <dbl>, highestQual <chr>,
## # highestQualCategory <chr>| Variable name | Description | Data type |
|---|---|---|
| responseID | ID number for respondent | Numeric |
| country | Country in which the respondent’s club competes | Categorical - England, Scotland |
| leagueOfFirstTeam | League that the club’s first team plays in | Categorical - Premier League, Scottish Premiership, Championship, League 1, League 2 |
| levelOfWork | Level of respondent’s work - categorical: 1st Team, Academy | Categorical: 1st Team, Academy |
| position | Respondent’s position | Categorical: Head (of department), Lead (senior staff member in a particular discipline), Coach (not Head or Lead positions), Intern, NA |
| dept | Respondent’s department / discipline | Categorical: Sport Science, S&C (Strength & Conditioning), or Both |
| partTime | Variable for identifying individuals who noted they are part-time employed at their club | String: Known part-time staff noted as ‘Part Time’ |
| academyCategory | For those working at Academy level, the Academy category status (according to designations by the Football Association (FA) or the Scottish Football Association | Categorical: 1, 2, 3, SFA Elite, Development |
| ageGroupAllPhases | For those working at Academy level, whether they support athletes across all Academy phases (as per age group designations set by the FA) | Logical: TRUE, FALSE |
| ageGroupPDPhase | For those working at Academy level, whether they support athletes in the Professional Development phase (U17s and older) | Logical: TRUE, FALSE |
| ageGroupYDPhase | For those working at Academy level, whether they support athletes in the Youth Development phase (U12s to U16s, inclusive) | Logical: TRUE, FALSE |
| ageGroupFPhase | For those working at Academy level, whether they support athletes in the Foundation Phase (U9s to U11s, inclusive) | Logical: TRUE, FALSE |
| reportedSalaryGBP | Reported salary | Numeric - currency, GBP (£) |
| salaryGBP | Salary, including reported values and estimated values based on additional comments provided by respondent (e.g., salary in GBP estimated based on conversion from another currency) | Numeric - currency, (£) |
| highestQual | Respondent’s highest qualification - text as entered by participant | String |
| highestQualCategory | Respondent’s highest qualification (categorical format) | Categorical: PhD, Postgraduate (higher than Bachelor but below PhD), Undergraduate, Unclear (based on respondent’s entry) |
Salaries by league
In this post, I will attempt to answer one simple question: What are the reported salaries of performance support staff working in UK soccer clubs when categorised by league?
(It’s worth noting here that this refers to the league in which the club’s first team plays, so it may not be the league that the respondent may predominantly work within, e.g., if they support the Academy programs.)
After a quick exploration when I first started working with this data set, I noticed that salaries varied considerably between respondents. To capture this, I decided to build box plots (to represent ‘typical’ salaries within a particular category), overlaid with a scatter plot where each dot represents one respondent. I also chose to present the the x axis categories such that the leagues progress from higher tier to lower tier as your gaze moves left to right.
# Set factor levels
soccerSalariesData$leagueOfFirstTeam <- factor(
    soccerSalariesData$leagueOfFirstTeam,
    levels = c(
        "Premier League", "Scottish Premiership", "Championship", "League 1", "League 2"))

# Create object to store axis labels with line breaks
labelsLeague <- c(
    "Premier\nLeague", "Scottish\nPremiership", "Championship", "League 1", "League 2")

# Create a list to store common theme options for use across plots
plotFeatures <- theme(
    plot.title = element_text(size = 16),
    plot.subtitle = element_text(size = 14),
    axis.title.x = element_blank(),
  axis.text.x = element_text(size = 11),
    axis.title.y = element_text(size = 16),
    axis.text.y = element_text(size = 11),
    legend.position = "none")

# Build the plot
p <- ggplot(soccerSalariesData, aes(x = leagueOfFirstTeam, y = salaryGBP))
p <- p + geom_boxplot(outlier.shape = NA, coef = 0)
p <- p + geom_point(alpha = 1/4, size = 4, aes(colour = leagueOfFirstTeam))
p <- p + scale_y_continuous(
    limits = c(0, 60000),
    breaks = seq(0, 60000, by = 10000))
p <- p + scale_x_discrete(labels = labelsLeague)
p <- p + labs(
    title = "UK soccer salaries of support staff",
    subtitle = "By league that the first team plays in",
    y = "Salary (GBP)")
p <- p + plotFeatures
salaryByLeague <- p

# Display the plot
salaryByLeague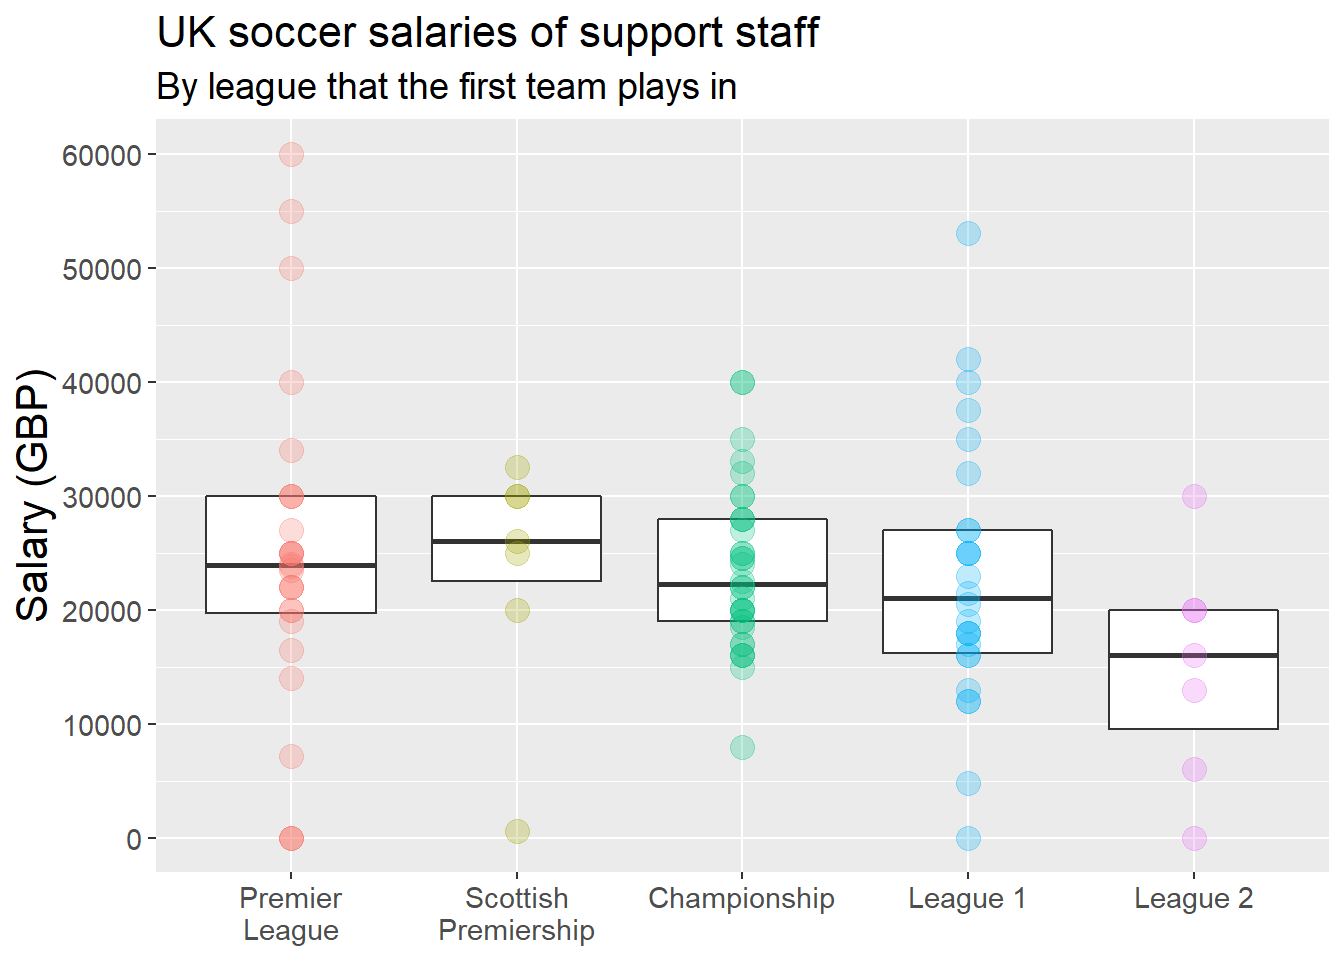
What about median reported salaries?
# Calculate median salary by league in which first team plays
medianSalariesByLeague <- soccerSalariesData %>%
    group_by(leagueOfFirstTeam) %>%
    summarise(median = median(salaryGBP, na.rm = TRUE))

# Rename variables for aesthetic purposes
colnames(medianSalariesByLeague) <- c(
    "League in which first team plays", "Median salary (GBP, £)")

# Display the table
medianSalariesByLeague %>%
    kable("html") %>%
kable_styling()| League in which first team plays | Median salary (GBP, £) |
|---|---|
| Premier League | 23930 |
| Scottish Premiership | 26000 |
| Championship | 22250 |
| League 1 | 21000 |
| League 2 | 16000 |
Key findings
1. Across the board, typical reported salaries are low.
- Given that 80 respondents were qualified at Masters or PhD level, these figures seem low. Such individuals might be competitive for university lecturer positions. Coventry University is advertising for an Assistant Lecturer in Sport and Exercise Science with a stated salary range of ~£26,000–£35,000 per annum. Meanwhile, a Lecturer / Senior Lecturer in Research Methods role at Nottingham Trent will pay somewhere in the range of ~£33,000–£48,000 per annum.
- FYI the UK’s National Living Wage for individuals aged 25 and over is £7.50 per hour (as from April 2017). With some ‘back of the napkin’ math, this works out to a full-time salary of approximately £12,600 per annum - calculated as £7.50 per hour x (35 hours / week) x (48 weeks / year).
- For the Australians among us (puts hand up), the typical salary for a performance support staff member working for a Scottish Premiership team—£26,000—works out to roughly $45,000 AUD (based on the exchange rate on 28/12/2017). Level A academics are paid approximately $64,000–$86,000 and Level B academics are paid approximately $91,000–$18,0000 (according to Deakin’s pay scales froeffective m April 2016).
Dave Carolan wrote on Twitter that the data set lacks representation from sport scientists and S&C coaches in English football who earn £100,000+ per annum. This is a fair critique of the data set. Several responses from higher-paid individuals certainly would increase the typical salaries seen here.
Great work Aiden. I believe that the lack of representation of the £100k+ club should be acknowledged. They exist in the PL & some Champ.
— Dave Carolan (@davecarolan) January 1, 2018
It’s important to capture the true nature of things, but the existence of some better remunerated roles does not take away from the 41 individuals who completed this small survey and reported being paid £20,000 or less. I’d argue that the push for fair wages is chiefly about i) the sustainability and credibility of the industry entire (“Pay peanuts, get monkeys!””), and ii) protecting the most vulnerable, such as those in the early stages of their career trying to get off the internship carousel. If you’re in the ‘£100k+ club’, being underpaid is probably not your personal current experience, although it may have been in the early days of your career. Hopefully, though, you care enough about the industry as a whole to want all individuals to be fairly paid for the work they’ve done (to gain the skills, experience, and qualifications needed to succeed in a given role), and the work they do (in this case, looking after the health, well-being, development, and performance of young men and women through football).
2. Performance support staff working for Scottish Premiership teams appear to be paid slghtly better than their counterparts in the Premier League. Having said that, it’s quite possible that this difference may be due to the small sub-sample of respondents in the Scottish Premiership category (n = 6).
3. There is considerable variation within most leagues.
- The ‘£0’ salaries have been left in the data set as a handful of (unpaid!!!) interns completed the questionnaire. Even if you were to remove these data points, though, sizeable variation remains. Also, the median is robust to outliers, so typical salaries do not change or change by a negligible amount when interns are excluded from the data set.
- This is partially due to some respondents working part-time in their roles. It was possible to identify whether some individuals were working part-time, based on the data entered by some participants, but the questionnaire itself did not explicitly ask this question.
Salaries by league and competitive level
We can drill down further, plotting the data by league and by competitive level; that is, whether respondents work for their club’s first team or academy.
# Build the plot
p <- ggplot(soccerSalariesData, aes(x = leagueOfFirstTeam, y = salaryGBP))
p <- p + facet_wrap(~levelOfWork)
p <- p + geom_boxplot(outlier.shape = NA, coef = 0)
p <- p + geom_point(alpha = 1/4, size = 4, aes(colour = leagueOfFirstTeam))
p <- p + scale_y_continuous(
    limits = c(0, 60000),
    breaks = seq(0, 60000, by = 10000))
p <- p + scale_x_discrete(labels = labelsLeague)
p <- p + labs(
    title = "UK soccer salaries of support staff",
    subtitle = "First Team vs. Academy",
    y = "Salary (GBP)")
p <- p + plotFeatures
salaryByLeagueAndCompLevel <- p

# Display the plot
salaryByLeagueAndCompLevel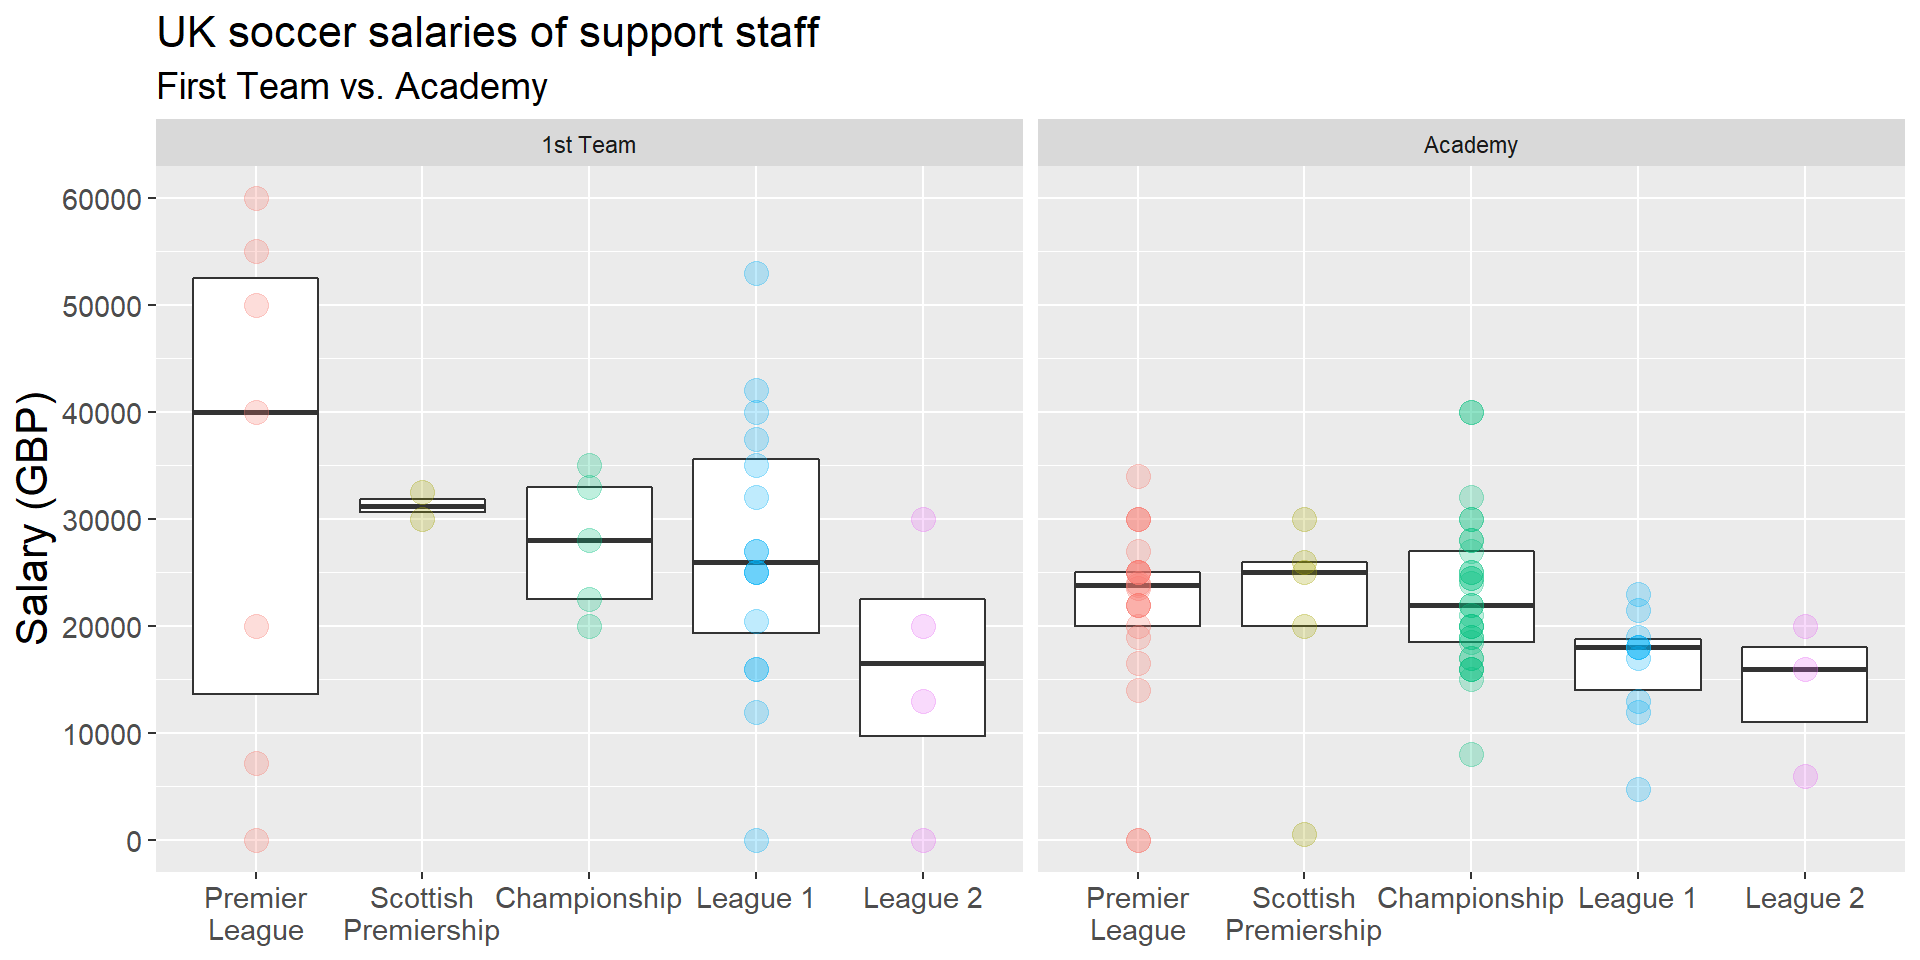
Meanwhile, median salaries now look like this:
# Calculate median salaries by league and competitive level
medianSalariesByLeagueAndCompLevel <- soccerSalariesData %>%
    group_by(leagueOfFirstTeam, levelOfWork) %>%
    summarise(median = median(salaryGBP, na.rm = TRUE))

# Order by $levelOfWork, then $leagueOfFirstTeam
medianSalariesByLeagueAndCompLevel <- medianSalariesByLeagueAndCompLevel[order(
    medianSalariesByLeagueAndCompLevel$levelOfWork,
    medianSalariesByLeagueAndCompLevel$leagueOfFirstTeam), ]

# Revalue duplicates in $levelOfWork for aesthetic purposes
medianSalariesByLeagueAndCompLevel$levelOfWork <- ifelse(
    duplicated(medianSalariesByLeagueAndCompLevel$levelOfWork),
    "", medianSalariesByLeagueAndCompLevel$levelOfWork)

# Rename variables for aesthetic purposes
colnames(medianSalariesByLeagueAndCompLevel) <- c(
    "League in which first team plays", "Competitive level", "Median salary (GBP, £)")

# Display the table
medianSalariesByLeagueAndCompLevel %>%
    kable("html") %>%
kable_styling()| League in which first team plays | Competitive level | Median salary (GBP, £) |
|---|---|---|
| Premier League | 1st Team | 40000 |
| Scottish Premiership | 31250 | |
| Championship | 28000 | |
| League 1 | 26000 | |
| League 2 | 16500 | |
| Premier League | Academy | 23860 |
| Scottish Premiership | 25000 | |
| Championship | 22000 | |
| League 1 | 18000 | |
| League 2 | 16000 |
Key findings
Categorising by league and by what I’ve termed ‘competitive level’ (first team vs. academy) helps to better visualise the salary gradient across the different leagues. This segmentation of the data gives us a better look at salary breakdowns, but also divides the relatively small sample into even smaller sub-groups. For instance, there were only 2 respondents who work for a Scottish Premiership first team, and only 3 respondents who work for a League 2 academy. Anyway, the data is the data, so let’s press on while keeping in mind that the results seen here may not hold with a larger sample and more representation within each sub-group.
Keeping the aforementioned caveats in mind, the results suggest that:
1. The typical salary of Premier League first team support staff (£40,000) is higher than for those who work for Scottish Premiership first teams (£31,250).
2. The differences between leagues are stark in terms of first team staff salaries, while the gradient is not so steep when it comes to academy staff salaries.
What’s next?
In the second post of this series, I will delve into whether staff salaries differ when the sample is categorised into sub-groups by level of job seniority. Stay tuned!